
BuzzGuard
Intelligent Remote Beehive Monitoring & Analytics
Turning a beehive into a connected, observable and intelligent system.
BuzzGuard is an integrated remote beehive monitoring platform developed to combine environmental sensing, acoustic monitoring, computer vision, machine learning and a mobile application into one connected workflow.
Instead of relying entirely on periodic manual hive inspections, BuzzGuard explores how continuous sensing and AI-assisted visual analysis can provide beekeepers with richer information about colony conditions.
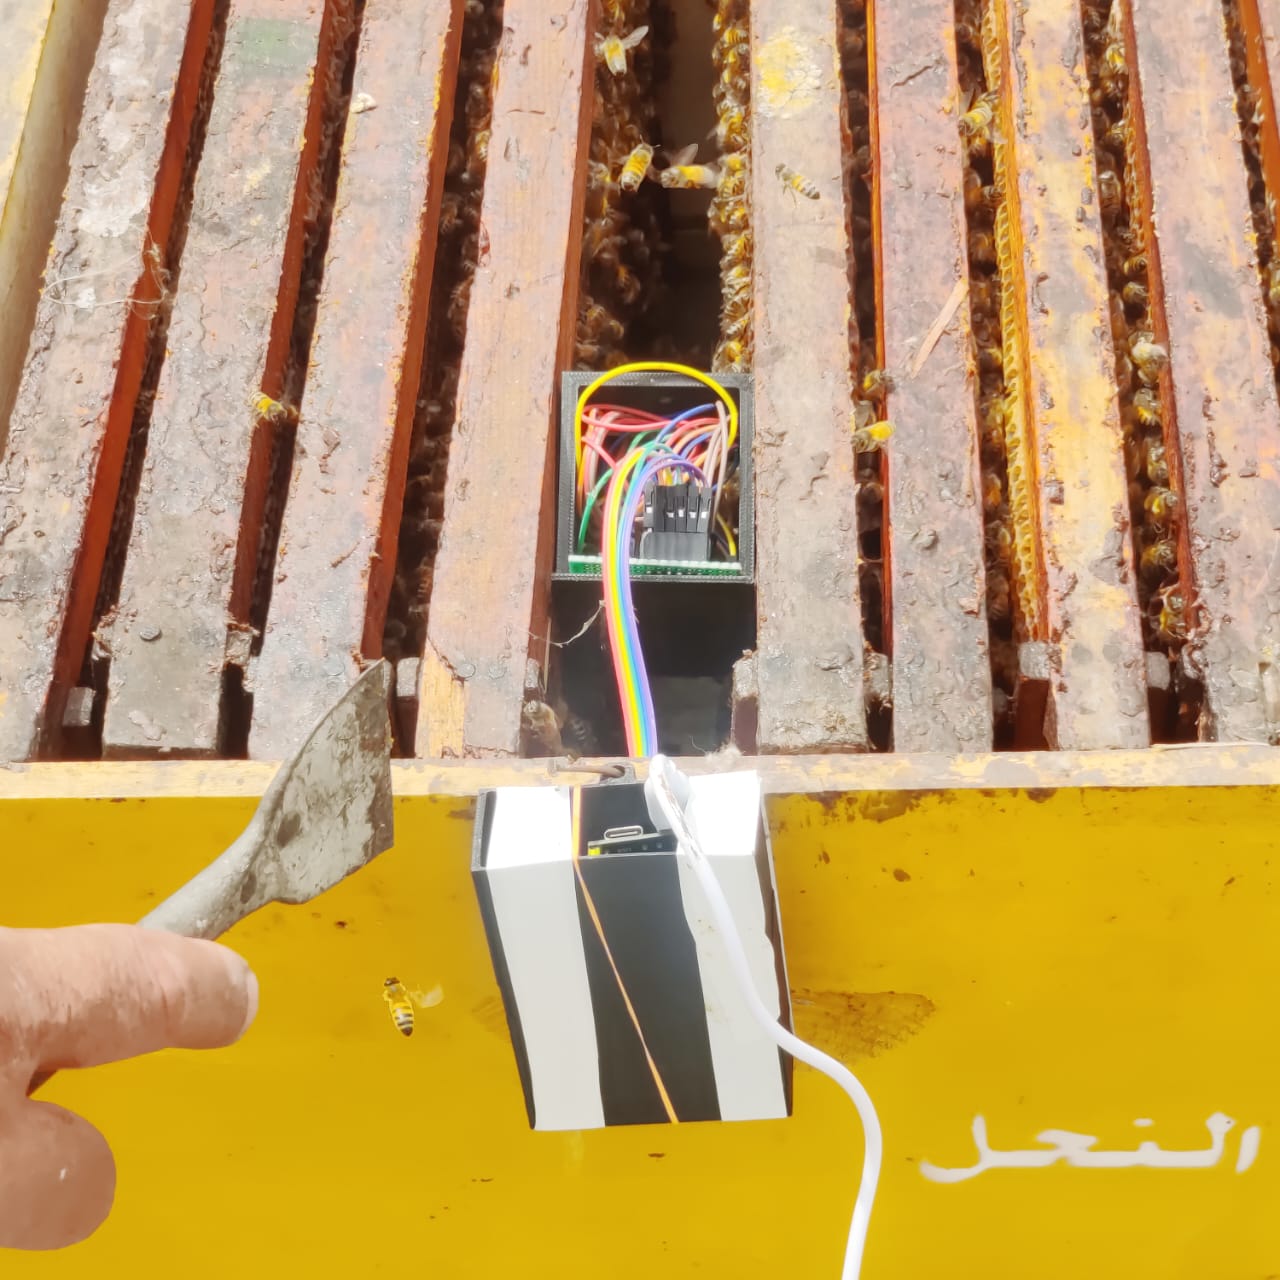
Beekeeping Has A Visibility Problem
Traditional hive inspection requires the beekeeper to physically inspect the colony. While manual inspection can reveal important information, it is periodic, intrusive, and dependent on the person performing the inspection. A hive can also experience changes between inspections.
What if a beekeeper could continuously observe important hive conditions without repeatedly opening and disturbing the colony?
Existing smart-monitoring approaches can also be fragmented — some focus primarily on environmental sensing, others on acoustics, others on visual inspection. BuzzGuard explores a multimodal approach rather than treating each source of information as an isolated system:
One System, Not One Model
BuzzGuard is not a single AI model or a sensor dashboard. It is an integrated system connecting the physical hive to data, AI and a user-facing application.
Building The Physical Layer
The hardware subsystem uses an ESP32-based embedded unit to collect information from the hive. The embedded unit was physically assembled and later integrated into a purpose-designed enclosure.
The core embedded controller running the sensing and connectivity logic.
Provides environmental measurements from within the hive.
Used for acoustic acquisition of hive sound.
The hardware was not left as a circuit-level concept. The sensing unit was assembled, enclosed and installed at a beehive farm for field testing and data collection.
From Hive To Cloud
The ESP32 publishes sensor information through MQTT. The backend subscribes to the incoming MQTT stream and processes and stores the data.
MQTT provides a lightweight communication mechanism suitable for IoT environments where network conditions may not always be ideal.
The ESP32 first attempts to connect using stored Wi-Fi credentials.
If the connection cannot be established within the configured period, the device can enter a Bluetooth Low Energy provisioning path so credentials can be supplied through the mobile application.
The system also validates the hardware identity and activation status against the backend before entering its normal monitoring loop.
This is presented as the connectivity architecture implemented in the prototype — not as production-grade IoT infrastructure.
Three Signals From The Hive
Environmental information about the hive.
Another important environmental indicator.
Sound generated within the hive.
The application converts these readings into historical graphs instead of displaying only isolated numbers.
A single reading provides limited context. Trends over time provide a much richer picture of how conditions are changing.
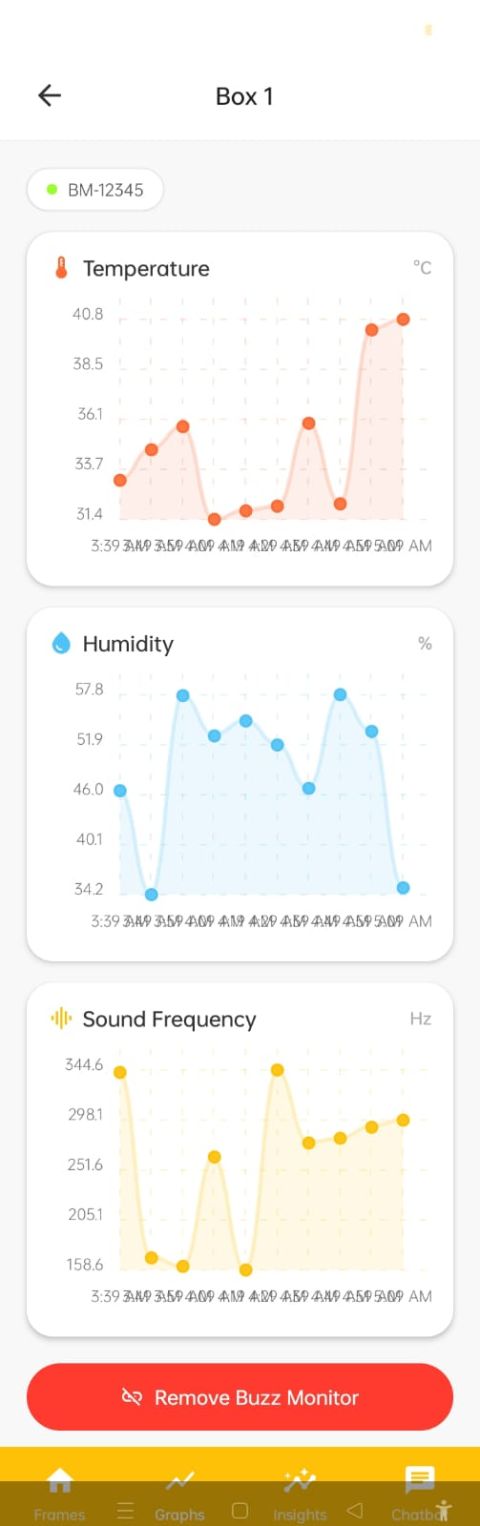
Actual app screenshot — live sensor graphs (Box 1)
Giving The System Eyes
Sensors can tell us about the environment surrounding the colony. They cannot directly tell us what is visible on a hive frame. Computer vision provides the visual layer of BuzzGuard.
The project developed multiple computer-vision workflows rather than relying on one generic model — different visual tasks required different approaches. Dataset organization and annotation were handled with Roboflow.
Individual visible bees across dense hive-frame imagery.
Presence and location of the queen on a frame.
Visible mites on bees and comb surfaces.
Cells associated with drone brood.
Stored pollen as a resource-availability indicator.
Presence of capped or visible honey on a frame.
Counting Bees In Dense Frames
The first major vision task was bee segmentation. The objective was to identify individual visible bees in crowded hive-frame imagery and convert those detections into a measurable bee count, using YOLOv8.
Looking Beyond Bee Counts
A bee count can describe visible activity. But identifying a mite, detecting the queen, or identifying drone cells can provide additional information relevant to colony inspection and management.
Not an autonomous medical or biological diagnosis system.
Understanding Hive Resources
Pollen provides information about resource availability and colony conditions. The system treats pollen as a separate visual problem because pollen has different visual characteristics from bees and mites.
Detecting Honey Presence
Honey presents a different computer-vision problem because it does not behave like a discrete object with a clear boundary. BuzzGuard treats this as an image-classification task.
Is honey present on this frame?
Sections 7–10 present the documented objective, dataset approach and training configuration for each model exactly as implemented in the underlying research. Detailed benchmark figures, confusion matrices and annotated dataset imagery are part of the project's internal technical documentation and are intentionally not fabricated for this public case study.
Turning Hive Sounds Into Colony-State Signals
The acoustic component converts raw hive sound into an interpretable colony-state signal. The implemented model is intentionally lightweight and rule-based.
Normal colony activity.
Potentially stressed, disturbed or queenless behavior according to the project's rule set.
Associated by the project with pre-swarm or active swarm behavior.
These frequency ranges form the rule-based classifier implemented in this research prototype. They should not be presented as universally validated biological thresholds.
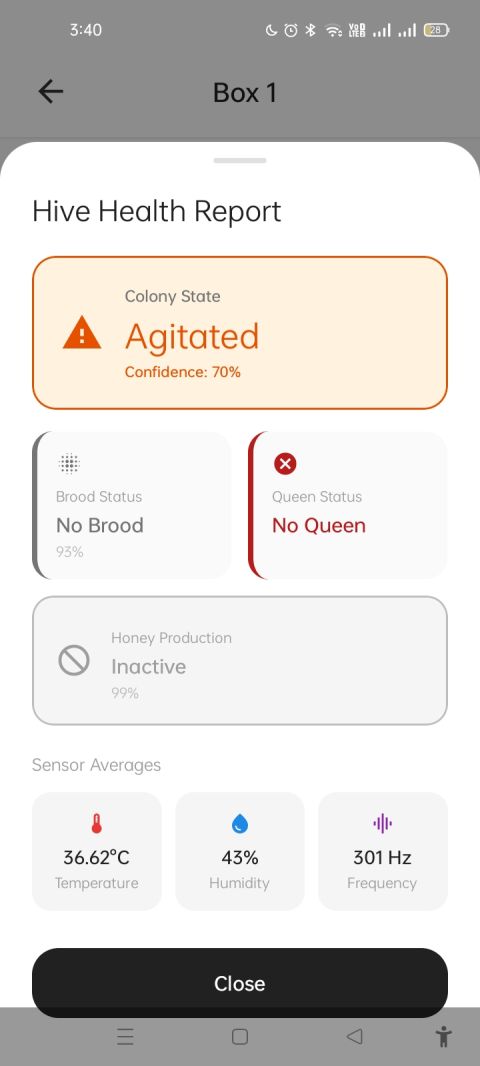
Actual app output — Colony State: Agitated (70% confidence), avg. 301 Hz
A real output: an average frequency of 301 Hz — inside the documented 250–480 Hz range — was classified as Agitated.
Where The Models Become One System
The project did not leave the hardware, models and application as separate demonstrations. Sensor data, acoustic analysis, hive images, computer vision, backend processing and the mobile application are connected into one workflow.
The backend uses a job-based architecture. A job begins in a pending state, the worker processes it, and the result is eventually marked complete.
The application listens for real-time status updates rather than requiring the user to repeatedly refresh the page — a major piece of the system's engineering.
Real-time sync means the beekeeper sees results the moment the pipeline finishes — not after manually refreshing or re-opening the app.
One Interface For The Entire System
The BuzzGuard mobile application provides the main user interface — from authentication and farm management through to live monitoring, AI results and a conversational assistant.
User registration and login.
Manage farms and associated hive boxes.
Select a hive/box and access associated frames.
Temperature, humidity and sound frequency.
Capture or upload hive-frame images.
Computer-vision and ML colony-state information.
Changes in frame-analysis indicators across scans.
Conversational assistance for interpreting system information.
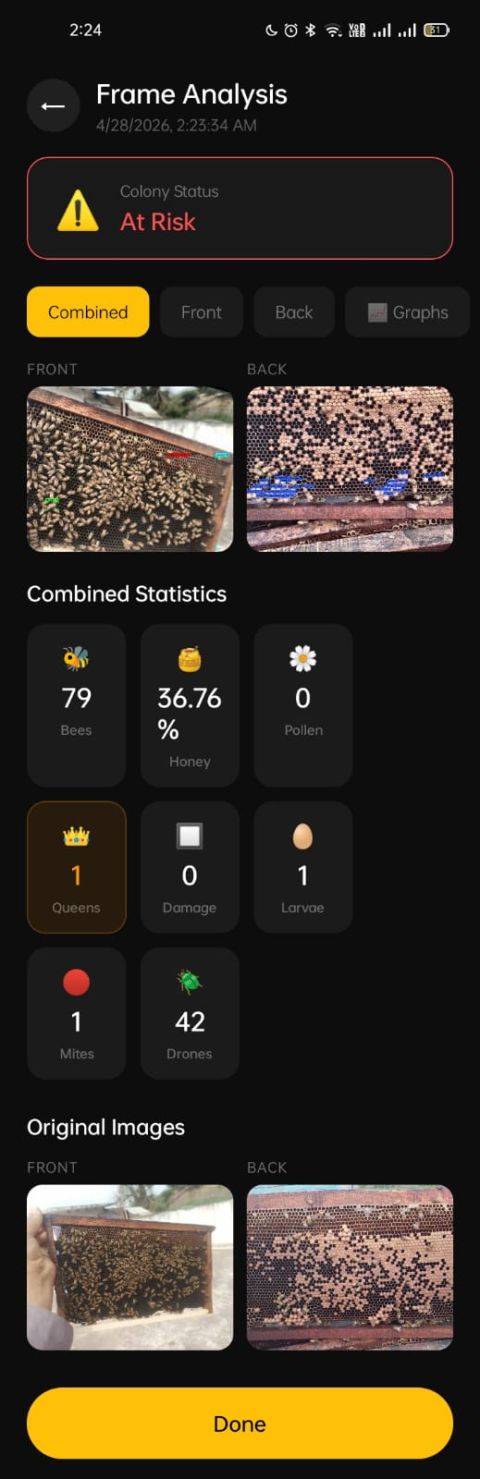
Frame Analysis
Live Graphs
ML Report
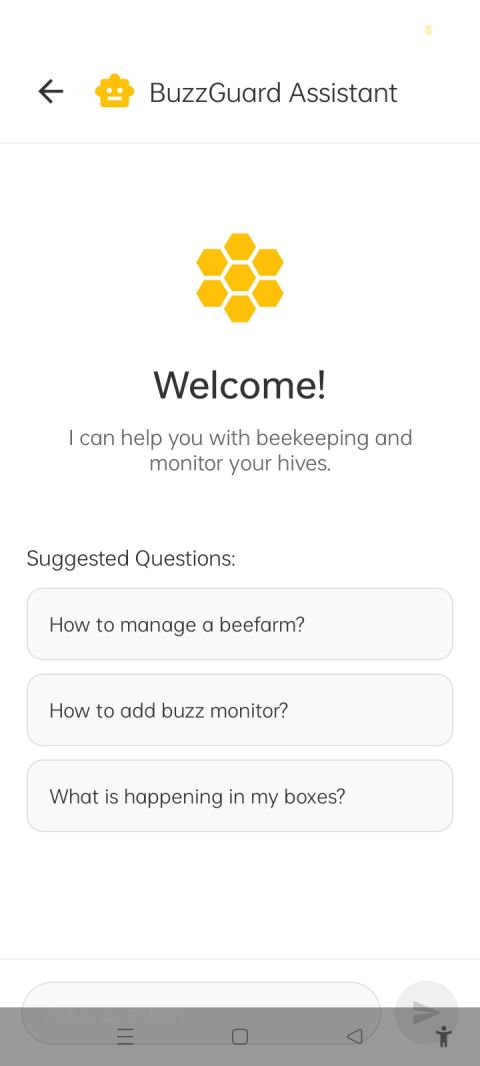
Chatbot
Actual output — Frame Analysis, Colony Status: At Risk
From Upload To Structured Inspection
The frame-analysis workflow allows users to capture or upload images directly through the application. The backend processes the image through the computer-vision pipeline and presents combined results, along with an overall colony/frame label where applicable.
The objective is not merely to return a model prediction. The objective is to turn the prediction into information a beekeeper can actually interpret.
Monitoring Change, Not Just Snapshots
Instead of showing only the result of a single scan, BuzzGuard can retain scan-wise visual indicators and allow users to observe how they change over time.
From Prototype To The Field
BuzzGuard progressed beyond circuit-level experimentation. The embedded monitoring unit was assembled, enclosed and physically installed at partner beehive farms for field data collection.
The prototype was installed at two partner sites — Al Nahl Farm and Nature Raw Organic Farm — where the project collected actual temperature, humidity and acoustic readings from the deployed system, demonstrating that BuzzGuard was engineered for interaction with a physical environment rather than remaining purely theoretical.
This reflects prototype field installations at two partner farms for testing and data collection — not a large-scale commercial deployment.
Development of BuzzGuard has received funding support from Kaya.inc (Turkiye).
What The Prototype Demonstrated
ESP32-based sensing unit integrated into a custom enclosure.
The device was physically installed at a beehive farm.
Temperature, humidity and acoustic data were collected.
Multiple visual-analysis models were developed for hive-frame inspection.
A lightweight acoustic classifier converted frequency readings into colony-state labels.
Sensor and image-processing workflows were connected through backend infrastructure.
A single application provided monitoring, analysis and user interaction.
IoT, acoustic analysis, computer vision and machine learning were integrated into one workflow.
What We Learned
The underlying research indicates that the system demonstrated technical viability and practical value — but also that the models are not perfect. Visual models can still experience confusion in visually difficult classes.
The prototype established the foundation for a connected, non-invasive monitoring platform while identifying the next engineering challenges required for production-scale deployment.
Where BuzzGuard Goes Next
The following are proposed future development directions — not existing capabilities.
Collect more hive imagery and sensor data across different conditions, seasons and apiaries.
Move beyond the current prototype models toward more robust visual and acoustic models.
Combine temperature, humidity, sound and vision into richer colony-level analysis.
Explore running selected inference workloads closer to the hive.
Scale the platform to manage many farms and hive boxes.
Move from monitoring current conditions toward identifying patterns that may precede important colony events.
Develop a more ruggedized, production-ready sensing enclosure.
Improve remote monitoring, notifications and large-scale data analytics.
What It Was Built With
Why BuzzGuard Matters To RoboNex
BuzzGuard represents the type of engineering problem RoboNex wants to solve.
The challenge was not simply to train an AI model. It was to build an entire system.
A physical device observes the environment. Data moves from the device to the backend.
AI interprets sensor and visual information. The backend coordinates the processing.
And the application turns the results into information a person can actually use.
This is the type of multidisciplinary engineering RoboNex is building around: connecting AI, software, hardware and real-world operations into practical intelligent systems.
We don't build AI for the sake of AI. We build systems around problems that exist in the real world.
At A Glance
Have A Real-World Problem Worth Solving?
BuzzGuard started with a real-world problem and required hardware, software, data and AI to solve it. If your organization has a problem involving AI, computer vision, IoT, automation, data or intelligent monitoring, RoboNex can help turn that problem into a working system.